
Nearly 6 in 10 retail investors skip the balance document before a purchase, missing a clear view of a company’s health at a single point in time.
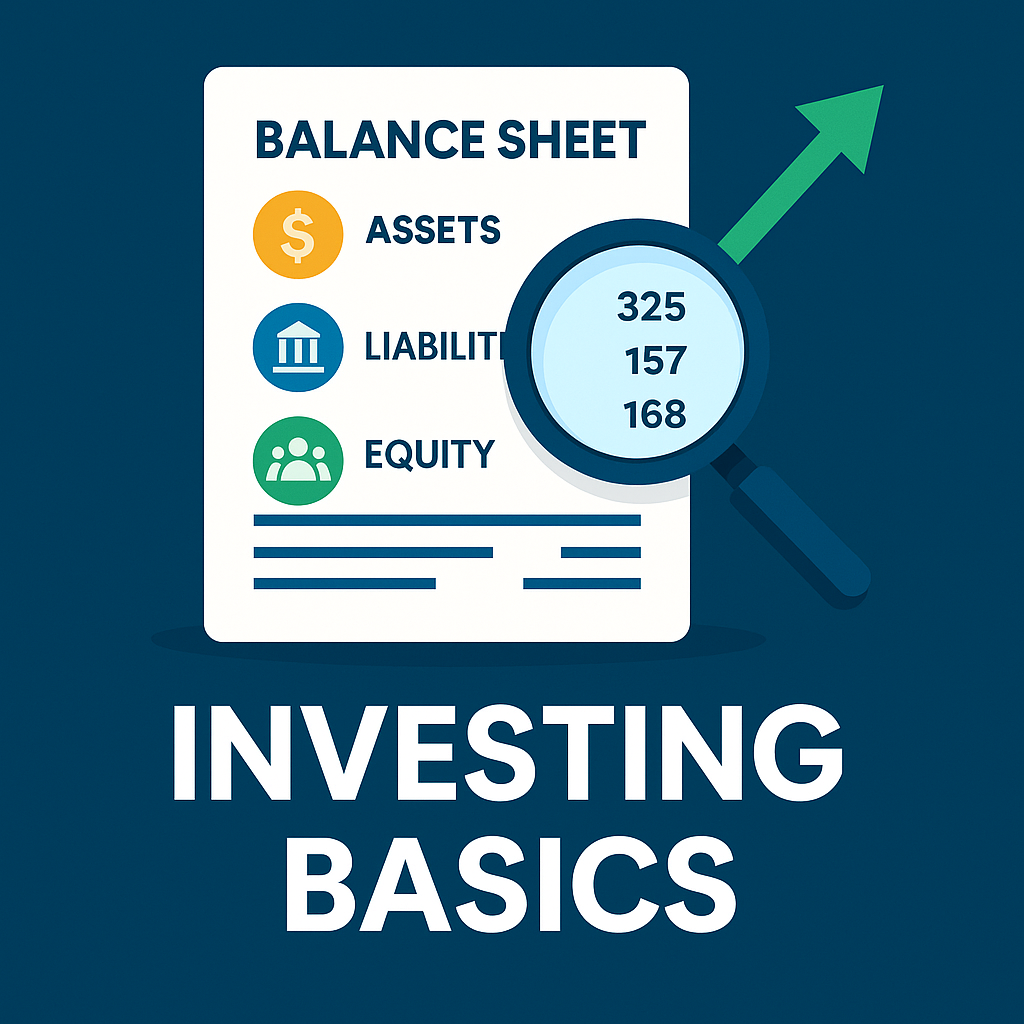
The balance sheet, often called the statement of financial position, gives a snapshot that shows assets, liabilities, and shareholders’ equity at a date. The core equation is simple: Assets = Liabilities + Shareholders’ Equity.
This snapshot matters before you enter the market. It reveals if a company can meet obligations, fund growth, and weather downturns without excessive borrowing. Paired with the income and cash flow reports, it anchors good decisions and steadier returns.
In India, listed company data is public and repeatable, making disciplined checks possible. Read the numbers as signals: solvency, liquidity, and capital strength that guide practical selections.

Key Takeaways
- The balance sheet is a point-in-time snapshot of a company’s position.
- Use the accounting equation as the verification backbone.
- Combine this view with income and cash flow documents for better judgments.
- It flags solvency, liquidity, and reliance on debt.
- Indian market data lets investors run repeatable checks before placing investments.
Why the Balance Sheet Matters Before Investing
A dated summary of what a company owns and owes anchors practical selection decisions. This single-page view verifies the accounting equation and shows assets, liabilities, and shareholders’ equity on one date.
Why it matters: the balance sheet is the foundation of fundamental evaluation. It gives investors a current-state snapshot that supports solvency and liquidity checks. That snapshot helps spot whether a business can meet obligations and fund growth without constant borrowing.
The decision snapshot in fundamental analysis
Use it as a first filter. Compare asset heft against obligations to judge downside protection. Look beyond totals: composition and trends—current versus long-term—matter for real company financial health.
From insights to smarter selection
- Prefer firms that finance growth prudently and limit repeated borrowing.
- Weigh debt versus equity to set risk and return expectations for investments.
- In India’s active market, disciplined reading helps separate resilient names from momentum plays.
Outcome: a repeatable process that leads to better decisions, fewer surprises, and a stronger base for valuation and thesis-building when combined with the other two reports.
What a Balance Sheet Shows: A Snapshot of a Company’s Financial Position
A single-day ledger lays out cash, receivables, debts, and equity in a clear, comparable format. It captures a company’s financial position at one point in time and supports quick cross-checks.
The accounting rule: Assets = Liabilities + Shareholders’ Equity. This formula must hold for every report and helps spot classification errors.
The accounting equation: Assets = Liabilities + Shareholders’ Equity
Assets appear first and are ordered by liquidity — cash, accounts receivable, inventory, then long-term asset like property and patents. Current items are those expected within one year.
How balance sheets are structured and dated in practice
Liabilities are grouped by timing. Current liabilities include accounts payable and short-term borrowings. Non-current items list bonds and long-term loans.
- Shareholders’ equity is the residual value: paid-in capital and retained earnings.
- Current designations anchor working capital and liquidity checks.
- Accurate classification matters: misplaced accounts distort ratios and the picture of financial position.
“The statement’s snapshot nature means you should compare multiple dates and other documents to see movement over time.”

| Section | Typical Items | What it shows |
|---|---|---|
| Assets | Cash, receivables, inventory, PPE, intangibles | Resource base and liquidity |
| Liabilities | Accounts payable, current liabilities, long-term debt | Short and long-term obligations |
| Shareholders’ Equity | Paid-in capital, retained earnings | Owner funding and retained profits |
Inside the Statement: Assets, Liabilities, and Shareholders’ Equity Explained
A clear breakdown shows what a firm owns, owes, and what remains for owners. This view is the heart of any good balance sheet and guides practical stock decisions for Indian investors.
Assets
Current assets include cash for immediate needs, accounts receivable as amounts due from customers, and inventory that spans raw materials to finished goods.
Non-current assets list property, plant and equipment that support operations for years, plus intangibles like patents. Depreciation lowers the carrying value of fixed asset items over time.
Liabilities
Current liabilities cover accounts payable and short-term obligations such as lines of credit due within the operating cycle.
Non-current liabilities include long-tenor loans and bonds that shape interest burden and refinancing risk. Proper classification matters — mislabeling can hide near-term obligations.
Equity
Shareholders’ equity shows owners’ residual claim: common stock plus retained earnings that reflect cumulative profit reinvested in the company.
Capital structure is the mix of debt and equity. That mix affects cost, flexibility, and resilience in market stress.
“Working capital — the gap between current assets and current liabilities — drives day-to-day liquidity.”
Put simply, assets must be financed by liabilities and shareholders. That balance shapes returns, stability, and how the company runs its operations.
How-To: how to read balance sheet for investing financial statement analysis stock inve
Start by confirming the totals: Total assets must equal total liabilities plus equity. If totals mismatch, classification or reporting errors could hide real risks.
Next, check short-term coverage. Compare current assets with current liabilities. In the sample, ₹80,000 of current assets versus ₹25,000 of current liabilities suggests solid liquidity.
Then inspect the asset mix. Look at cash, the quality of receivables, and inventory turnover. Assess whether long-term assets justify their book values and support growth plans.
Now review debt posture. Identify short-term borrowings and long-term loans, then compare them with owners’ capital. A ₹50,000 long-term loan against ₹1,15,000 equity often looks manageable.
Watch for high cash balances: determine if cash comes from recurring operations or one-off asset sales. Also note asset-light models; low long-term assets can still support scalable growth.
- Quick scan: large fixed assets funded by short-term debt raises refinancing risk.
- Final step: read the income and cash flow reports to confirm profitability and real cash generation.

Essential Balance Sheet Ratios for Investors
Simple metrics can reveal whether a firm uses capital well or carries hidden risk.
Debt-to-Equity measures total debt divided by shareholders equity. A higher result signals greater leverage and potential strain from interest costs. Long-term bonds and non-current liabilities raise solvency risk if earnings fall.
Current Ratio is current assets divided by current liabilities. A value above 1 suggests short-term coverage, but timing and quality of those assets matter for real liquidity.
Return on Equity (ROE) equals net profit attributable to owners divided by average equity. Persistent high ROE often points to efficient capital use or durable advantages in the market.
Asset Turnover is revenue divided by average total assets. Higher turnover means the asset base drives sales effectively and supports operations.
“Compare ratios year on year and against peers. Context separates temporary boosts from sustainable strength.”
| Ratio | Formula | What it warns or shows | Practical benchmark |
|---|---|---|---|
| Debt-to-Equity | Total debt ÷ shareholders equity | Leverage and serviceability | Example: 50,000 debt ÷ 1,15,000 equity ≈ 0.43 (moderate) |
| Current Ratio | Current assets ÷ current liabilities | Short-term liquidity | Above 1 is healthy; check asset quality |
| ROE | Net profit ÷ average equity | Profitability for owners | Higher than sector median suggests advantage |
| Asset Turnover | Revenue ÷ average assets | Efficiency of assets in driving sales | Rises with lean operations or revenue growth |
Dashboard approach: track these 3–5 ratios each year and benchmark by sector. That gives investors a clearer view of company quality than one number alone.
Red Flags and Quick Checks Before You Buy
Quick inspections can reveal pressing issues that undermine long-term returns. Focus on debt service, cash generation, and shareholder buffers first.
Watch these red flags:
- Excessive debt versus equity: high leverage with weak earnings raises serviceability risk and interest pressure.
- Negative cash flow trends: recurring operating outflows suggest the company may not sustain growth despite reported profits.
- Declining retained earnings: shrinking reserves point to cumulative losses or heavy payouts that thin the equity cushion.
- Frequent equity dilution: repeated share issuances can erode per-share value for shareholders over time.
Run two fast checks before entering the market:
- Ensure total assets meaningfully exceed total liabilities. If not, downside protection is limited.
- Confirm current assets cover current liabilities. Inventory-heavy mixes or slow accounts receivable need extra scrutiny.

“If multiple flags cluster—high debt, weak cash flow, thinning equity—reconsider participation.”
Trend and Peer Analysis for Company Financial Health in India
Track multi-year trends to see whether a company is building strength or slipping into risk. Compare three to five years of balance sheets to spot steady growth in shareholders equity, falling leverage, or creeping weakness.
Review past years
Look for rising retained earnings and consistent asset quality. Steady cash conversion from profits signals resilience in slow markets.
Benchmark with peers
Compare sector medians so capital intensity and normal cycles are accounted for. A company that lags peers on return on capital deserves extra scrutiny.
Real examples and cautions
ITC and Infosys often show ample liquidity and conservative capital choices, making them resilient in downturns. Small-caps can present rapid top-line stories while hiding thin equity and rising debt.
- Use audited annual documents and filings from the MCA portal for primary data.
- Consider aggregators like Probe42 for consolidated sheets and historical information.
- Cross-check cash, assets, and capital allocation trends before deciding.
| Company Type | Liquidity | Leverage | Disclosure |
|---|---|---|---|
| Large-cap (example) | High | Low–Moderate | Strong audited reports |
| Mid-cap | Moderate | Variable | Mixed quality |
| Small-cap | Often low | Often high | Watch for gaps in documents |
“Combine multi-year trends, peer medians, and disclosure quality for a holistic view of company health in India.”
Linking the Balance Sheet to Income and Cash Flow Statements
When the three reports align, you can trace profit into cash and capital moves with confidence.
Solvency, profitability, and liquidity: a three-statement view
Solvency lives on the balance sheet: compare assets with liabilities and check shareholders’ equity for buffers.
Profitability comes from the income report and shows whether recurring operations generate earnings that can be retained.
Liquidity appears across the balance sheet and cash flow. Operating cash flow confirms if profit converts into usable cash.

A practical workflow for selection using all three statements
Use a simple, repeatable process before you commit capital.
- Screen for balance sheet strength: assets should meaningfully exceed liabilities and equity must not be eroded.
- Confirm profit trends: look for steady earnings and rising retained capital that match the equation—Assets = Liabilities + Shareholders’ Equity.
- Validate cash flow: operating inflows must support working capital swings and CapEx shown as asset additions.
- Reconcile accounts movements: rising receivables should appear as cash collection later in operating cash flow.
- Decision gates: invest when solvency is sound, profitability is durable, and liquidity is proven across reconciled reports.
“No single page tells the whole tale; the three statements together confirm whether profits become real cash and lasting capital.”
| Focus | Where to check | Key sign |
|---|---|---|
| Solvency | Balance sheet | Assets > Liabilities; healthy equity |
| Profitability | Income statement | Stable net profit and margin |
| Liquidity | Cash flow & balance sheet | Positive operating cash flow; manageable working capital |
Conclusion
Treat the company snapshot as a compass: it shows solvency, funding mix and the scale of retained capital that backs growth.
Use the balance sheet together with the income and cash flow reports. Confirm that assets exceed liabilities, that leverage is manageable, and that shareholders equity grows over years.
Key checks: apply D/E for leverage, Current Ratio for short-term coverage, ROE for efficiency and Asset Turnover for use of resources. Compare trends and peers in the local market and rely on audited filings.
Action: start with simple ratios today, build a repeatable process, and let strong sheets guide safer investments and clearer decisions.
FAQ
What is the core purpose of a company’s balance sheet?
The balance sheet offers a snapshot of a company’s resources and obligations at a single date. It lists assets, liabilities, and shareholders’ equity so investors can judge solvency, liquidity, and capital structure before buying shares.
What does the accounting equation tell investors?
Assets = Liabilities + Shareholders’ Equity. This simple rule ensures the books balance and shows whether a company funds assets with debt or owner capital — a key clue about risk and durability.
Which assets matter most for short-term safety?
Current assets like cash, marketable securities, receivables, and inventory matter most. They indicate whether the firm can meet near-term obligations without selling long-term assets or raising emergency financing.
How should I view long-term assets when valuing growth potential?
Long-term or fixed assets (property, plant, equipment, intangibles) often support future revenue and competitive advantage. Assess useful life, impairment risks, and whether investment aligns with strategic growth plans.
Which liabilities raise the biggest red flags?
Large, maturing short-term debt, rising accounts payable, and increasing long-term borrowings relative to equity can signal stress. Also watch off-balance-sheet obligations and contingent liabilities disclosed in notes.
How does shareholders’ equity inform my view of financial health?
Equity reflects owner claims after debt. Growing retained earnings and stable equity often signal profitable operations and retained capital for reinvestment. Shrinking equity or repeated dilution can hurt shareholder value.
What quick ratios give a useful first check?
The current ratio and quick ratio check liquidity. Debt-to-equity gauges leverage. Return on equity shows how well management converts capital into profit. Use them as initial filters, not final judgments.
Why compare ratios across years and peers?
Single-period metrics can mislead. Trends reveal improving or worsening conditions. Peer comparisons set realistic expectations for margins, leverage, and asset efficiency within an industry context.
How do the income and cash flow statements complement the balance sheet?
The income statement shows profitability over a period; the cash flow statement shows cash generation and use. Together with the balance sheet they reveal solvency, sustainability of earnings, and quality of reported profits.
What are common warning signs on financial statements?
Recurring negative operating cash flow, rapidly rising debt, persistent losses, frequent equity issuance, and large write-downs are common red flags. Check notes for explanations and management’s remediation plans.
How should I treat one-off items and non-recurring gains or losses?
Adjust earnings and equity for one-time items when estimating ongoing profitability. Non-recurring gains can inflate metrics like ROE; digging into footnotes clarifies whether performance is sustainable.
What role do audit notes and disclosures play?
Notes and audit reports provide details behind line items: accounting policies, contingencies, leases, related-party transactions, and risk factors. They often hold the context needed for sound decisions.
How often should investors review a company’s balance sheet?
Review quarterly and more deeply at year-end. Also reassess after major corporate events like acquisitions, debt issuance, or share buybacks that materially change the capital structure.
Are small-cap balance sheets riskier than large-cap ones?
Small caps often have thinner liquidity, higher leverage, and less diversified revenue, which raises risk. Large caps like Infosys or ITC typically show stronger balance sheets, but always check company-specific details.
Can a strong balance sheet guarantee stock performance?
No. A solid balance sheet lowers default and liquidity risk, but stock returns depend on growth, competitive position, valuation, and macro conditions. Use the statement as one pillar in a broader analysis.


