
Surprising fact: over 70% of active retail traders check visual price signals before placing trades, making chart literacy a key edge in the share market.
This short guide explains what this study of price action and volume means, and why it matters to NSE and BSE participants in 2025.
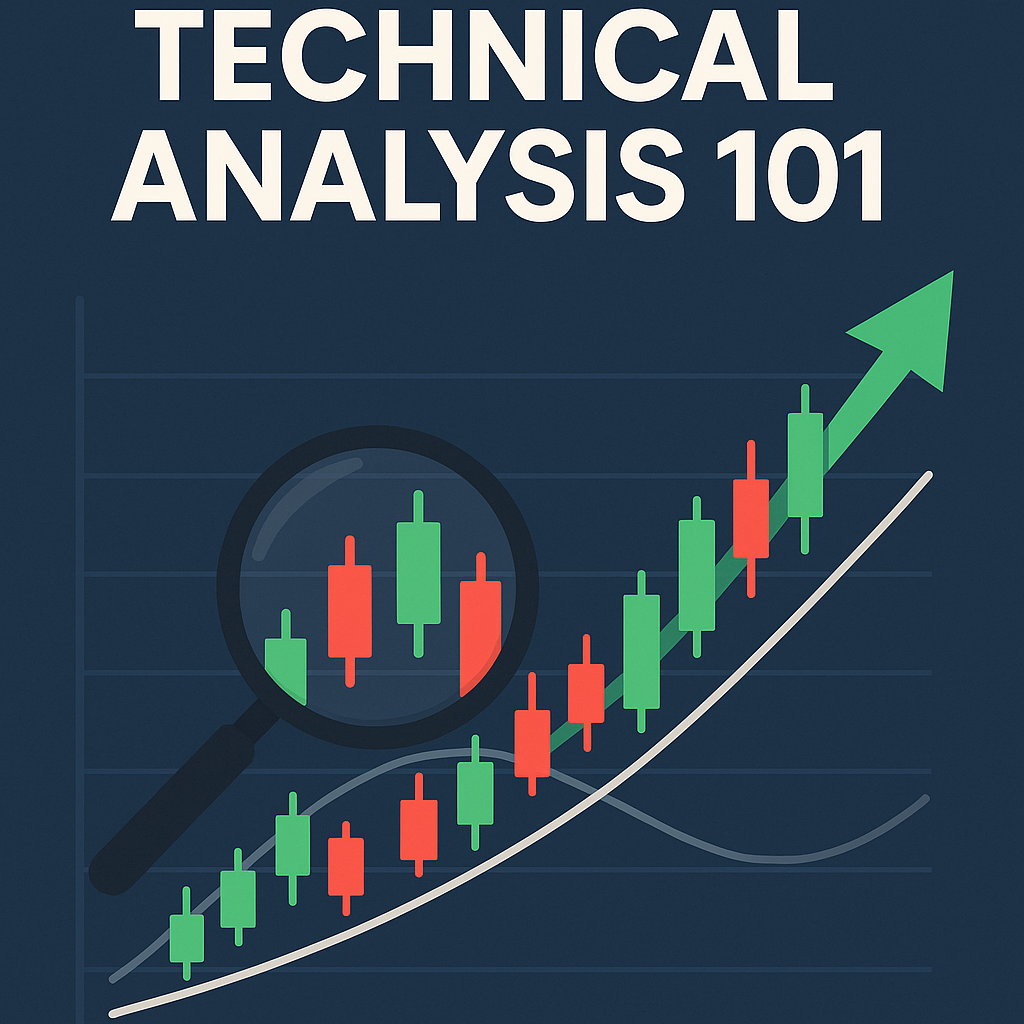
We define the approach as the study of open, high, low, and close on candlesticks, plus volume and repeatable formations that help traders map risk and probability.
Platforms such as TradingView India, Zerodha Kite, and Upstox Pro make practice easy. A green candle (close higher than open) suggests buyers led the session; a red candle shows sellers had control. Combine candles with volume spikes and support/resistance to improve timing.
Start small: paper trade or use demo modes, set stop-loss and size positions, and focus on daily practice. By the end of this guide you will spot high-probability setups and avoid common mistakes in the Indian market.
Key Takeaways
- Charts show price action and volume to help time entries and exits.
- Green vs. red candles reveal session-level buyer or seller control.
- Use TradingView India, Zerodha Kite, or Upstox Pro to practice safely.
- Risk rules—stop-loss and position sizing—must accompany every signal.
- Paper trading builds confidence before using real capital.
Why Technical Analysis Matters for Stock Trading in India in 2025
Charts compress order flow into visuals that help traders judge momentum, trend health, and likely turning points fast. In a fast-moving market, this ability gives retail participants clearer entry and exit signals.
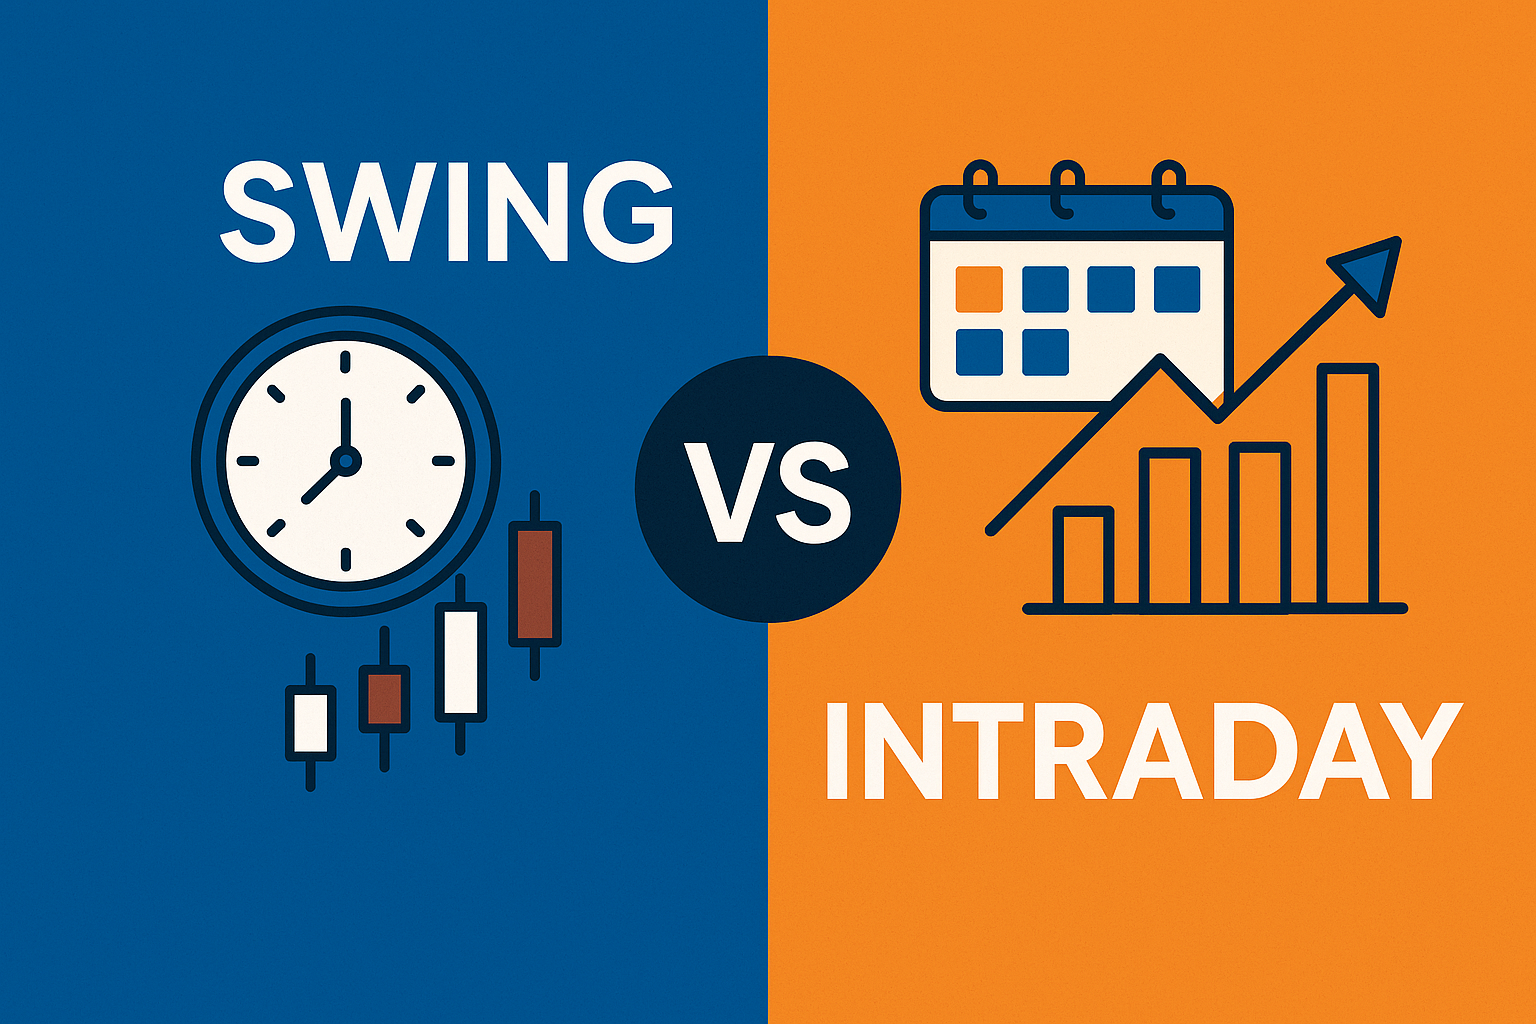
Use daily and weekly frames for swing trades, and 5–15 minute frames for intraday moves. Look at body and wick size, then scan for reversal shapes such as hammer or engulfing candles.
Confirm signals with volume and nearby support or the 200 EMA. A breakout with a volume surge and a retest at support/resistance has much better accuracy than a lone signal.
Practical workflow
- Pick timeframe by objective: 5–15 min for scalps, daily/weekly for positional trades.
- Scan recent candles and assess bodies and wicks for momentum clues.
- Seek confluence: pattern + volume spike + support/resistance (e.g., 200 EMA).
- Focus on liquid names and indices (Nifty 50, Bank Nifty, Reliance, HDFC Bank) where moves are cleaner.
| Step | What to check | Why it helps |
|---|---|---|
| Timeframe | 5–15 min / daily / weekly | Matches signal horizon to trade objective |
| Candle structure | Bodies, wicks, closes | Shows momentum and rejection levels |
| Volume | Spikes on moves | Confirms strength and better accuracy |
| Support / Resistance | Horizontal levels, 200 EMA | Validates entries and reduces false breaks |
Foundations: What Is Technical Analysis and How It Differs from Fundamental Analysis
At its core, this method studies price swings, volume flows, and recurring formations on graphs to gauge market intent.
Definition: It is a method to evaluate securities by studying prices, volume, and recurring patterns on charts. A single candle shows open, high, low, and close for the chosen period. Body size and wick length reveal momentum and volatility; color shows whether buyers or sellers led the session.
How it differs: fundamental study looks at earnings, revenue, and macro health of a company. This chart-focused approach instead reads market behaviour and timing. Use both—fundamentals for long-term value, and this method to time entries, exits, and manage risk.

Why volume matters: Volume confirms moves. A reversal formation gains credibility when volume spikes and the trend context supports it.
- Timeframe-agnostic: works on minutes to months.
- Rely on confluence: trend + formation + volume + indicators.
- Maintain a checklist: trend, support/resistance, candles, indicator confirmation, volume, and a risk plan.
No single tool guarantees success. Mastery comes from practice, journaling trades, and reviewing winners and losers to refine rules.
Core Chart Types Used by Indian Traders
Traders use three main visuals to follow market moves: line views, OHLC bars, and candle displays. Each offers a different lens on momentum and helps predict near-term movements.
Line charts
Line charts plot close prices across periods to smooth noise. They give a clean trend view at a glance and help spot directional bias over time.
Bar charts
Bar charts show open, high, low, and close in a compact form. Traders favor them for intraday layouts where many bars appear on screen and quick high/low context matters.
Candlestick charts
Candlestick charts add a filled body to OHLC data, making sentiment and volatility obvious. Many Indian traders use TradingView India, Zerodha Kite, or Upstox Pro to switch the time frame between 5–15 minutes for intraday and daily/weekly for swings.
Each bar or candle represents a specific specific time period. Changing the period changes granularity and trade horizon.
| Type | Strength | Best use |
|---|---|---|
| Line | Simple trend clarity | Quick trend skim and long-term bias |
| Bar | Compact OHLC detail | Intraday setups and precise highs/lows |
| Candlestick | Immediate sentiment cues | Entries/exits using body and wick signals |
Tip: Start with candlestick chart views to learn momentum cues, then align a higher timeframe trend with lower timeframe execution to boost probability. Consistent settings and routine make it easier to read candlestick charts and spot recurring behavior around news and earnings.
How to Read Candlesticks: Open, Close, High, Low, and Market Sentiment
Each candle tells a compact story: where price opened, the extremes it hit, and where it closed.
Anatomy: the body shows the range between open and close prices. Wicks (shadows) mark the session highs and lows. A green candle means buyers closed higher; a red candle means sellers closed lower.

Candle clues and momentum
Long bodies point to strong momentum. Small bodies suggest indecision or consolidation. Long wicks show rejection at key levels and flag possible reversals.
Pick the right time frame and platform
Match the time frame to your plan: 5–15 minute windows for intraday, daily or weekly for swings. On TradingView India, Zerodha Kite, or Upstox Pro, switch frames, add a volume pane, and save layouts to repeat the workflow.
Confirm with volume and levels
Read candlestick signals in context: look for volume expansion near support, resistance, or the 200 EMA. Confluence—price action + volume + nearby levels—boosts accuracy and reduces false moves.
- Note O/H/L/C each session to map short-term market sentiment.
- Journal screenshots of setups to speed learning and improve trade decisions.
Essential Candlestick Patterns: Bullish and Bearish Reversal Signals
A few reliable reversal setups—when read with trend and volume—offer high-probability trade ideas.
Definition: A reversal marks a likely change in direction. Traders use specific candlestick patterns to spot these turns early and manage risk.
Bullish signals to watch
Hammer: A small body near the top with a long lower wick at a downtrend low. It shows sellers were absorbed and strong buying emerged.
Morning Star: A three-bar bullish reversal: a long red, then a small indecisive bar, then a strong green candle closing into the first. It signals a shift to buyers.
Bullish Engulfing: After a drop, a large green candle fully engulfs the prior red body. This engulfing move suggests buyers took control.
Bearish signals to watch
Shooting Star: A small body with a long upper wick at highs. It often follows a failed breakout and warns of selling pressure.
Evening Star: The bearish three-bar mirror of the Morning Star: strong green, small middle bar, then a big red that closes into the first—buyers lose grip.
Bearish Engulfing: A large red body engulfs the prior green body after an uptrend. This engulfing move hints at a possible bearish reversal.
“Confirm any reversal with a follow-through candle and rising volume; context wins over a lone signal.”
| Pattern | Type | Key clue | Best confirmation |
|---|---|---|---|
| Hammer | Bullish reversal | Long lower shadow at swing low | Higher close next day + volume |
| Morning Star | Bullish reversal | 3-bar sequence ending with strong green | Close into first bar + trend support |
| Shooting Star | Bearish reversal | Long upper shadow at swing high | Lower follow-through + rising volume |
| Evening Star | Bearish reversal | 3-bar sequence ending with strong red | Close into first bar + trend alignment |
Practice tip: Test these candlestick patterns on liquid Nifty 50 names. A green candle near prior lows adds conviction for a bullish reversal. Always wait for confirmation and volume to reduce false signals.
Support, Resistance, and Trend Direction
Identify key horizontal zones where price has repeatedly stalled or bounced; these mark the battle lines between buyers and sellers. Start by marking visible swing highs and swing lows, gaps, and areas with clustered volume. Levels that saw multiple tests often hold more weight than one-off moves.

Identifying horizontal levels and reacting to price action
Define support as zones where demand historically emerged and resistance where supply capped advances. Mark them using prior swings, gap edges, and high-volume nodes near the 200 EMA.
React to price action at these zones. Look for rejection wicks or strong closes to decide if the zone held or failed. Wait for a candle close on your chosen time frame before acting.
Spotting trends: uptrend, downtrend, sideways
Spot trends by swing structure: higher highs and higher lows denote a top uptrend; lower highs and lower lows show a downtrend. Overlapping swings signal a sideways market.
- Combine levels with trend alignment for continuation trades; avoid fading strong trends without clear reversal evidence.
- Use multi-touch validation—levels tested multiple times matter more, but late touches can fuel breakouts.
- Trail stops below/above recent structure to protect gains; plan for retests to filter false breaks.
technical analysis basics India candlestick patterns chart reading for beginner: Must-Know Indicators
Use a small set of complementary indicators to confirm what price and volume already suggest. These tools help you filter noise and aim for better accuracy when planning entries and exits.
Moving averages: SMA vs EMA
SMA smooths price evenly over a period. It gives a clear long-term bias.
EMA reacts faster and often acts as dynamic support or resistance. Traders use the 20/50/200 EMA mix in trending stock moves to align trade direction.
RSI: momentum and divergence
RSI marks overbought/oversold zones near 70/30. Prioritize divergences and context over fixed thresholds to avoid late signals.
MACD: trend strength and momentum shifts
MACD combines fast/slow EMAs, a signal line, and a histogram. Use crossovers and histogram shifts to confirm the trend shown by moving averages.
Bollinger Bands: squeeze to breakout
Compressed bands often precede volatility expansion. A band squeeze followed by a volume pop and a break of a key level makes a stronger trade signal.
Practical template: 20/50/200 MAs for trend, RSI for momentum, MACD for confirmation, Bands for volatility cues. Keep volume visible and align each indicator with the trade time frame.
“Indicators are aids, not replacements for price structure and levels.”
Quick cautions: avoid piling on too many indicators. Excess tools create lag and conflicting signals. Use just enough to get confluence and a cleaner edge in the market.
From Analysis to Action: Simple Trading Approaches
Convert what you see on screens into disciplined buys and sells with three proven approaches. Below are concise playbooks that link price action to clear entries, stops, and exits. Follow time frames that match your objective and keep risk per trade consistent.

Trend following
Ride a top uptrend when price sits above rising 20/50/200 MAs and makes higher highs and lows. Enter on pullbacks into moving averages or support resistance zones.
Place stops below the last swing low and trail them under structure as the stock advances. Prefer names that show relative strength vs the Nifty.
Breakout trading
Wait for range compression, then take a level break with decisive volume. Better quality breakouts have prior consolidation and a clean retest of the broken level.
Use Morning/Evening Star or Engulfing signals near the level as precise risk points. Stop beyond the level plus a volatility buffer.
Momentum trading
Combine RSI shifts with MACD confirmation and a strong buying candle as the entry signal. Pick frames that suit your holding time and avoid switching mid-trade.
Manage size so loss equals 0.5–1.5% of capital. Take partial profits at 1R–2R and trail winners with MAs or structure. Keep a short checklist: trend, level, pattern, volume, risk.
Avoid These Common Mistakes Most Beginners Make
One clear rule: a lone signal rarely suffices. Combine trend, volume, and level context before committing capital.
Common traps: chasing a reversal signal without level validation, over-relying on a single oscillator, and skipping stop-loss rules.
Over-relying on one indicator without confluence
Do not treat one moving average or oscillator as a final answer. Seek confluence between price structure, candles, indicators, and volume.
Ignoring stop-loss and risk per trade
Set a fixed risk per trade and a stop-loss before entering. This habit protects capital in a volatile share market.
Trading without confirmation from volume or support resistance
Wait for a candle close and volume expansion near key levels. Trades without confirmation often end as false starts.
“Paper trade until your setups show consistent edge; live trading should follow measurable results.”
| Mistake | Why it fails | Quick fix |
|---|---|---|
| Single-indicator reliance | Leads to false entries | Require 2+ confirming signals |
| No stop-loss | Large avoidable losses | Predefine risk and size position |
| Ignoring volume/levels | False breakouts and whipsaws | Wait for retest or volume spike |
Keep a trade journal with screenshots and notes. Practice on a demo account to internalize rules before risking real money in the share market.
Final tip: focus on process over short-term wins. Small, steady improvements beat sporadic big returns and help traders survive to trade another day.
Conclusion
Start small, practice on a demo account and make steady progress. Mastery of candlestick charts grows through daily review, testing ideas, and logging outcomes.
Use candlestick views to interpret O/H/L/C and sentiment, then confirm moves with volume and nearby levels. Favor liquid NSE names and trusted platforms such as TradingView India, Zerodha Kite, or Upstox Pro before risking capital.
Keep strategies simple: trend following, clean breakouts with volume, and momentum entries. Protect capital with fixed risk, size positions sensibly, and record every trade in a journal.
Avoid chasing quick wins. Aim to read candlestick charts reliably, refine your process, and grow into a confident trader in the stock market.
FAQ
What is the best way to read price action using candlesticks?
Start by identifying each candle’s open, high, low, and close. A long green body shows strong buying; a long red body shows strong selling. Look for wicks to spot rejection at price extremes. Confirm signals with nearby support and resistance and check volume for strength before acting.
How do bullish and bearish engulfing signals work?
A bullish engulfing occurs when a green candle fully covers the prior red candle, suggesting buyers stepped in strongly—best near a support level or after a down move. A bearish engulfing is the opposite: a large red candle that swallows the prior green candle, indicating sellers may take control. Use volume and a confirming close in the following candle for higher reliability.
Which time frame should I use on TradingView, Zerodha Kite, or Upstox Pro?
Match the time frame to your trading style. Day traders prefer 1–15 minute charts for intraday moves. Swing traders use 1-hour to daily charts to capture multi-day trends. Always check a higher time frame (daily or 4-hour) for the dominant trend to improve trade alignment.
How do I spot a hammer and what does it mean?
A hammer has a small body near the top of the candle and a long lower wick. It signals rejection of lower prices and potential bullish reversal when it appears after a downtrend. Confirm with a higher close next session and rising volume to reduce false signals.
What role does volume play in confirming signals?
Volume shows participation. When a reversal candle or breakout comes with higher-than-average volume, it suggests commitment from buyers or sellers, making the signal more reliable. Low volume breakouts often fail or get retraced.
How do I use moving averages for support and resistance?
Simple moving averages (SMA) smooth price over a period; exponential moving averages (EMA) react faster to recent price changes. Use a 50 or 200 SMA as dynamic support/resistance on daily charts. Shorter EMAs (9–21) help with entry and exit timing in trending moves.
What are common mistakes beginners make with indicators?
Relying on a single indicator, ignoring confluence from price action, and skipping stop-loss rules are common errors. Indicators lag; combine them with support/resistance, volume, and candle context to reduce false signals.
How can I spot a reliable breakout?
Look for price closing beyond a horizontal level or pattern, accompanied by increased volume and a successful retest that holds the breakout level. Check higher time-frame trend direction to avoid fading major resistance or support.
When should I trust a reversal signal like morning star or evening star?
Trust these signals when they form at key horizontal levels or trend extremes and when the middle candle shows indecision. Higher volume on the confirming candle and supportive signals from RSI or MACD add weight to the reversal case.
What settings work well for RSI and MACD in Indian markets?
Common RSI settings are 14 periods with 70/30 overbought/oversold levels. MACD default (12,26,9) works for many traders; watch crossovers and histogram direction. Adjust to shorter periods for faster signals, but expect more noise.
How do Bollinger Bands help spot volatility squeezes?
Narrow bands indicate low volatility—a squeeze. A subsequent band expansion with a directional close often signals a breakout. Confirm direction with volume, moving average slope, and momentum indicators before entering.
Can I trade using just candlestick signals?
You can, but accuracy improves with confluence. Combine candle signals with support/resistance, volume, and at least one momentum or trend indicator. Risk management—position sizing and stop-loss—is essential regardless of the method.
How should I set stop-loss and targets using candles and support/resistance?
Place stop-loss below/above recent swing lows/highs or the wick of the reversal candle, allowing for market noise. Set targets at the next significant support/resistance or use a risk-reward ratio such as 1:2 or 1:3, adjusting for volatility.
What is the difference between SMA and EMA for intraday trading?
SMA gives equal weight to all periods, producing smoother lines. EMA gives more weight to recent prices and reacts faster to short-term moves, making it more suitable for intraday entries and exits where speed matters.
How do I practice reading charts without risking money?
Use paper trading features on TradingView, Zerodha’s Kite paper trading, or Upstox Pro demo accounts. Backtest simple rules on historical data and keep a trade journal to learn which signals work best for your time frame and risk tolerance.


